Overview
The leading provider of business, HR and payroll services, ADP worked with Think Company to leverage its rich human capital data to design an insights platform that gives executives and managers a better understanding of their workforce. Think Company’s technologists and ADP’s team also developed accessible, platform-agnostic code to better serve ADP’s customer base.
Industry
HR, Payroll, & Tax Services Company

Company Revenue
$15B+
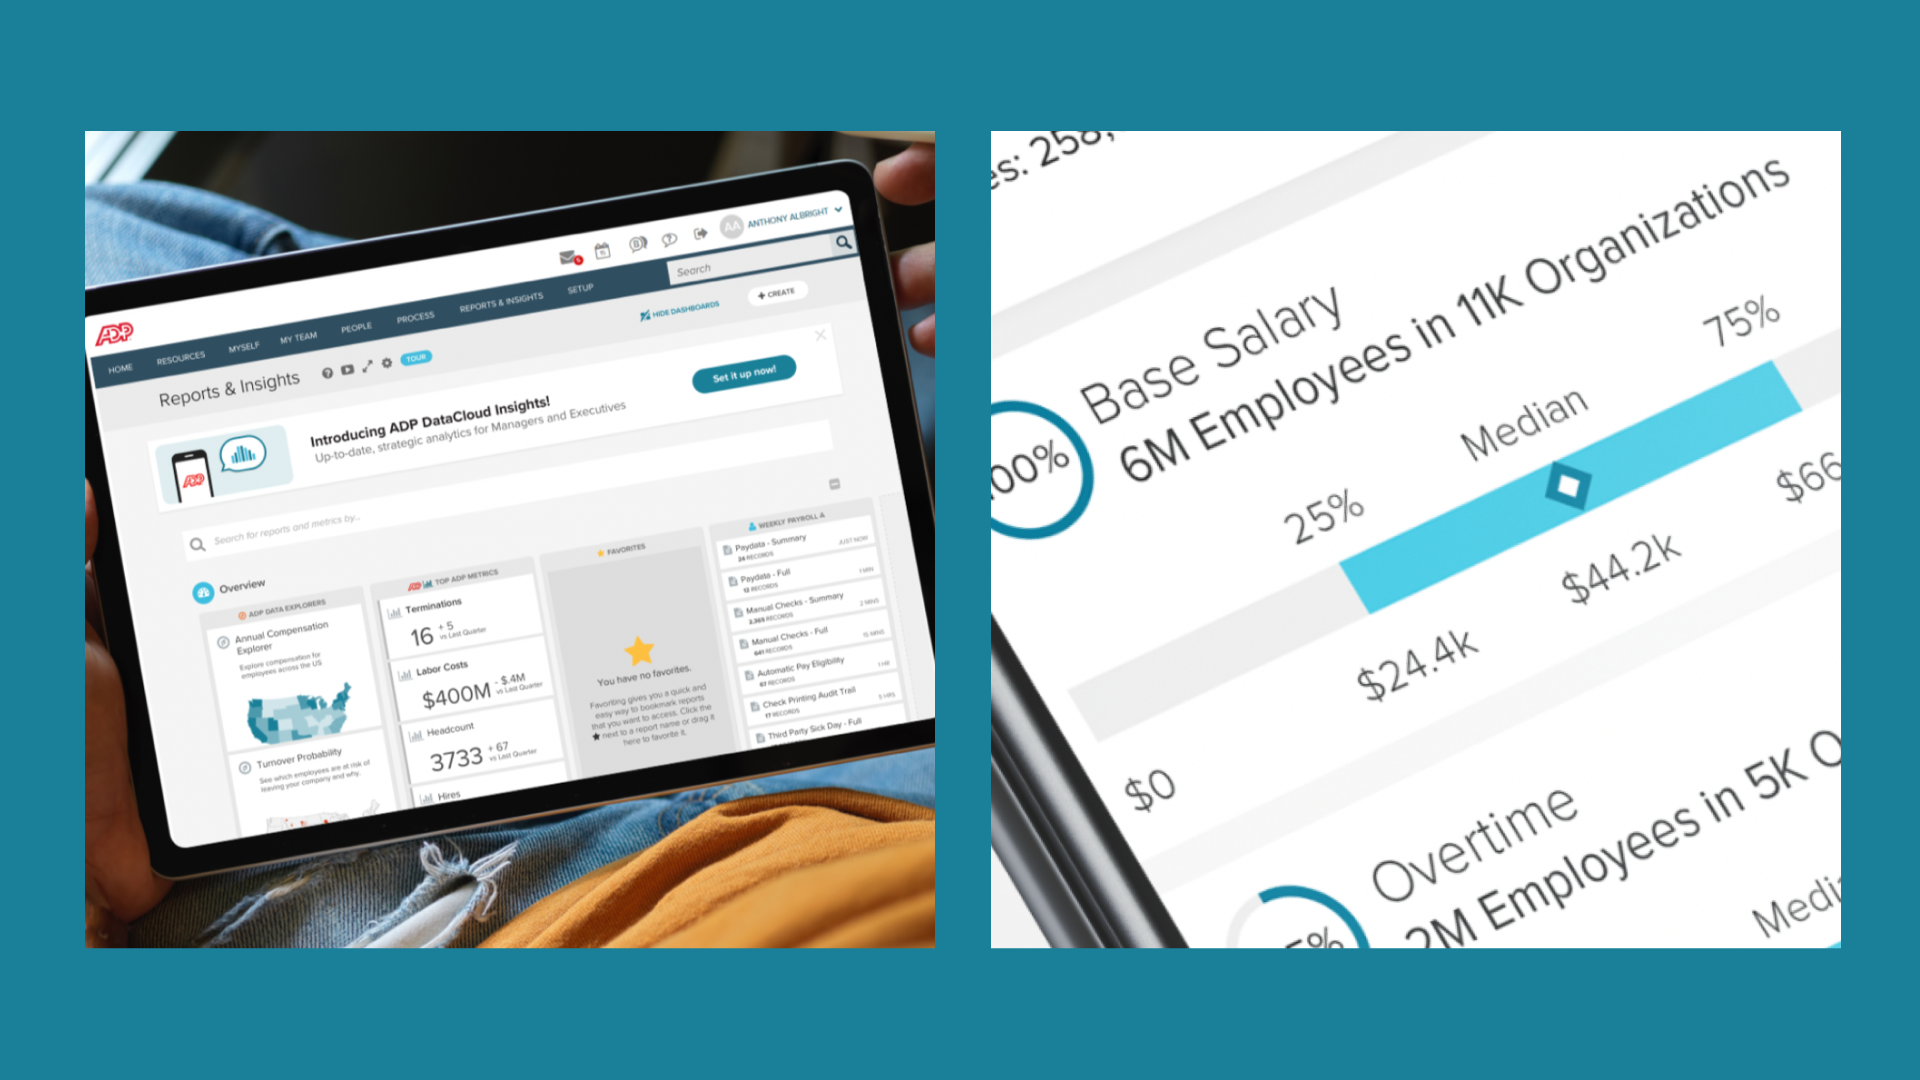
Translating user needs into data visualizations
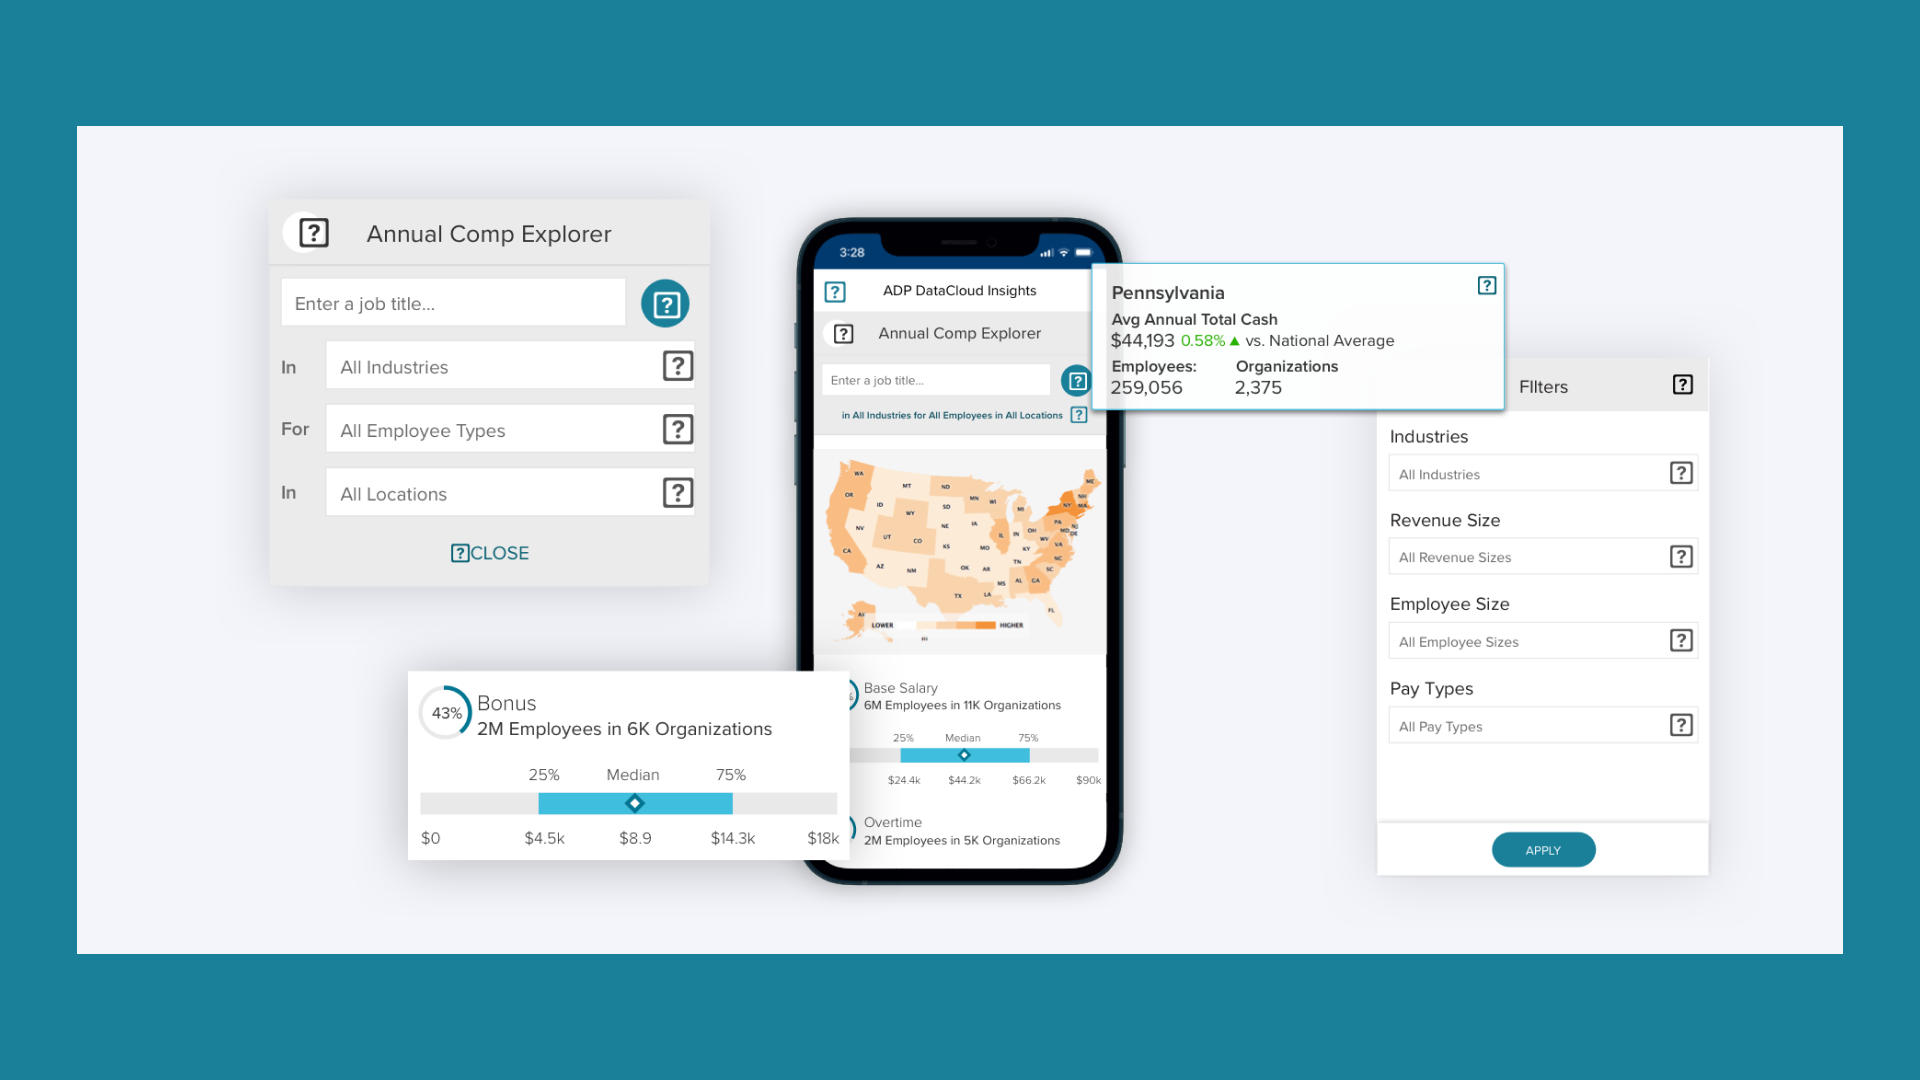
Core to our Dashboard and Data Visualization design process is understanding the underlying metrics and how people will use them. ADP connected us with HR Managers who frequently parsed data for both managers and executives. Metrics like turnover rate, cost of labor, and how employee compensation influenced hiring and retention practices. Our plan: provide curated trends and peer benchmark data so they can make informed decisions.
A flexible design system for a
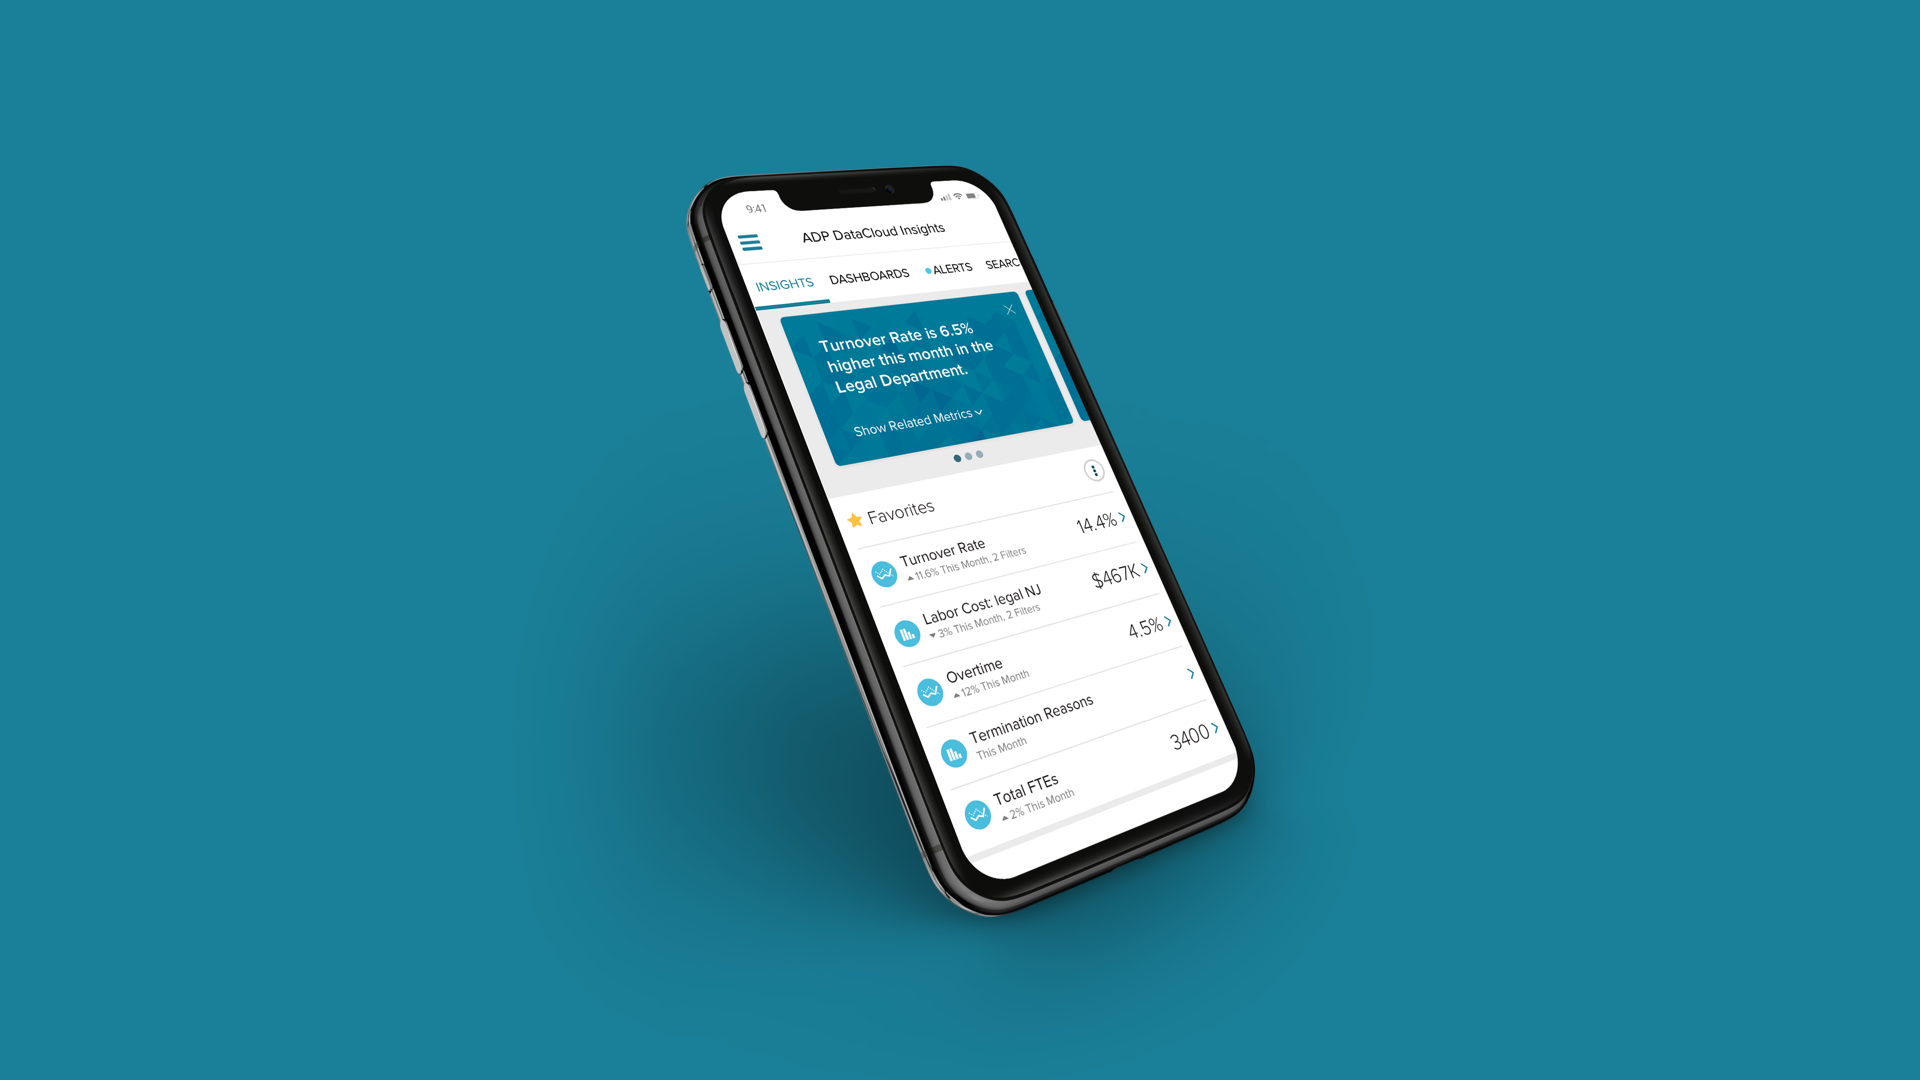
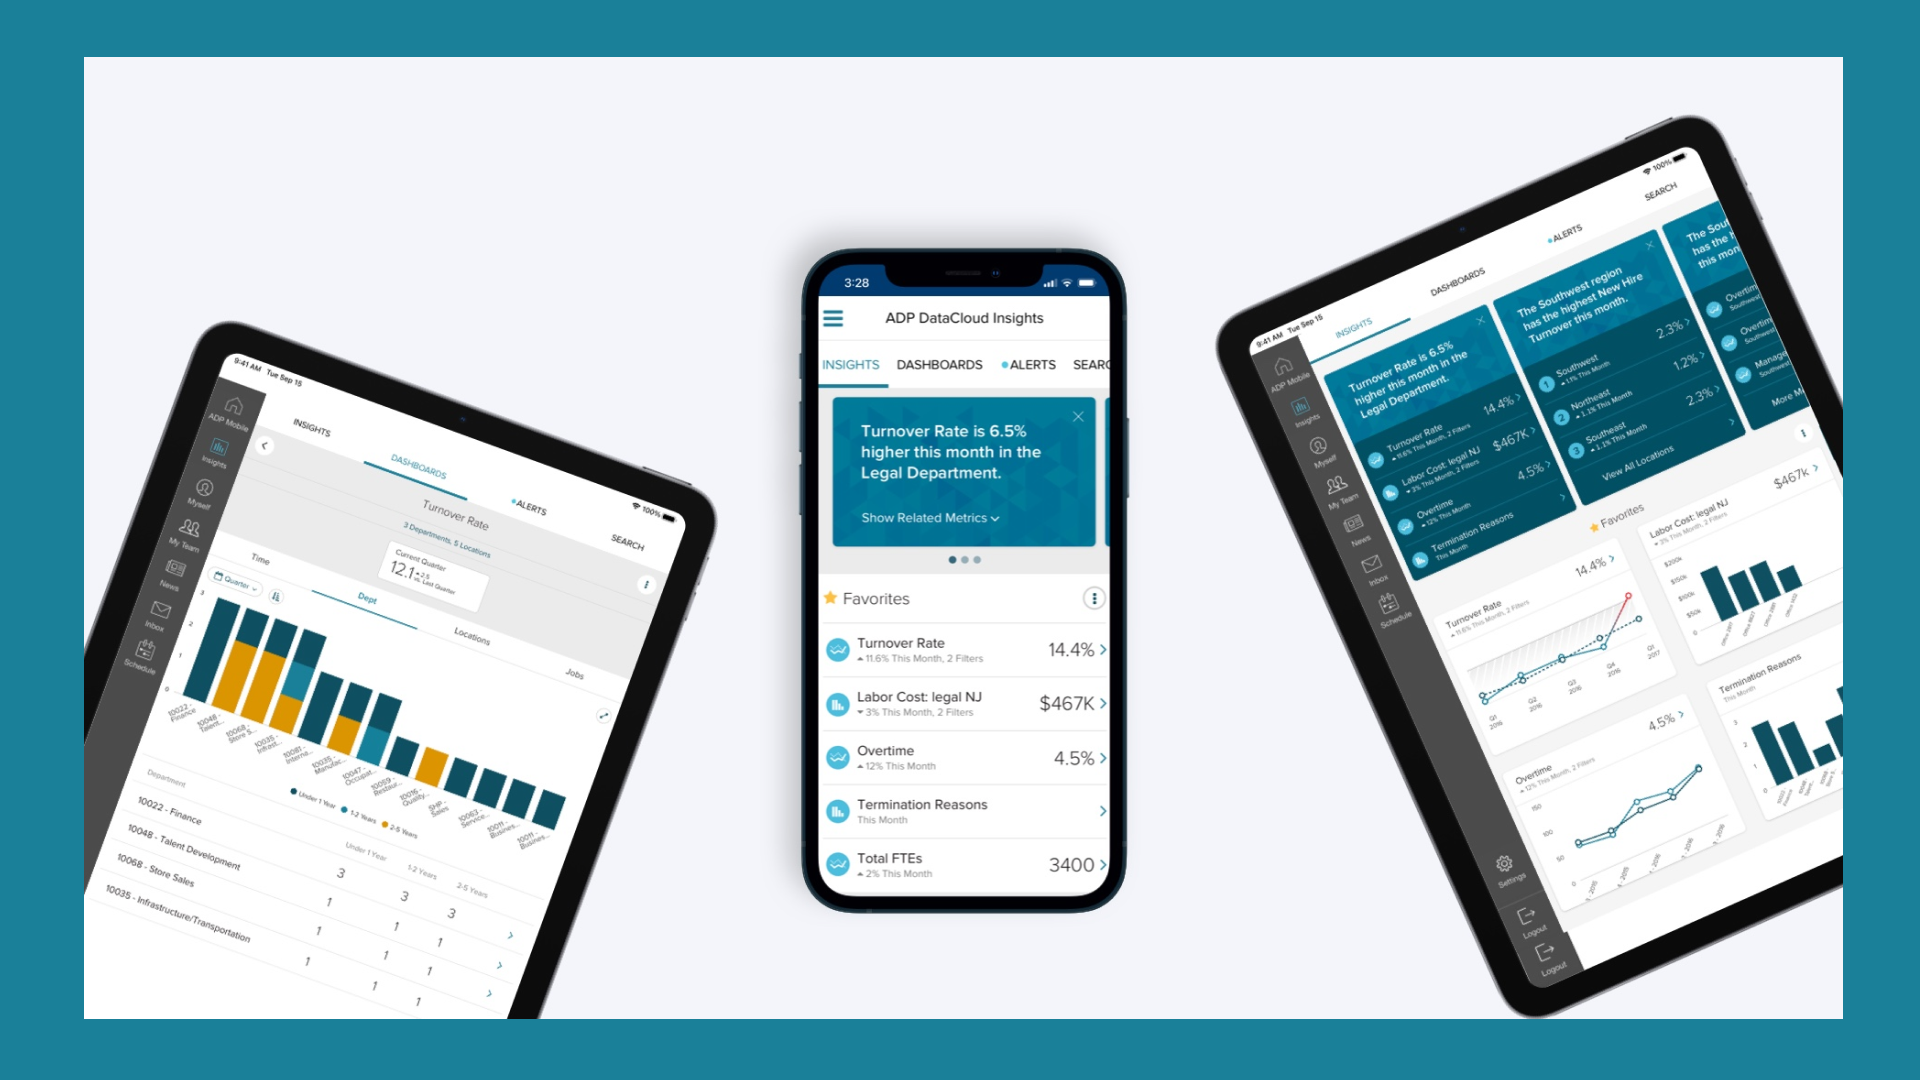
mobile-first approach
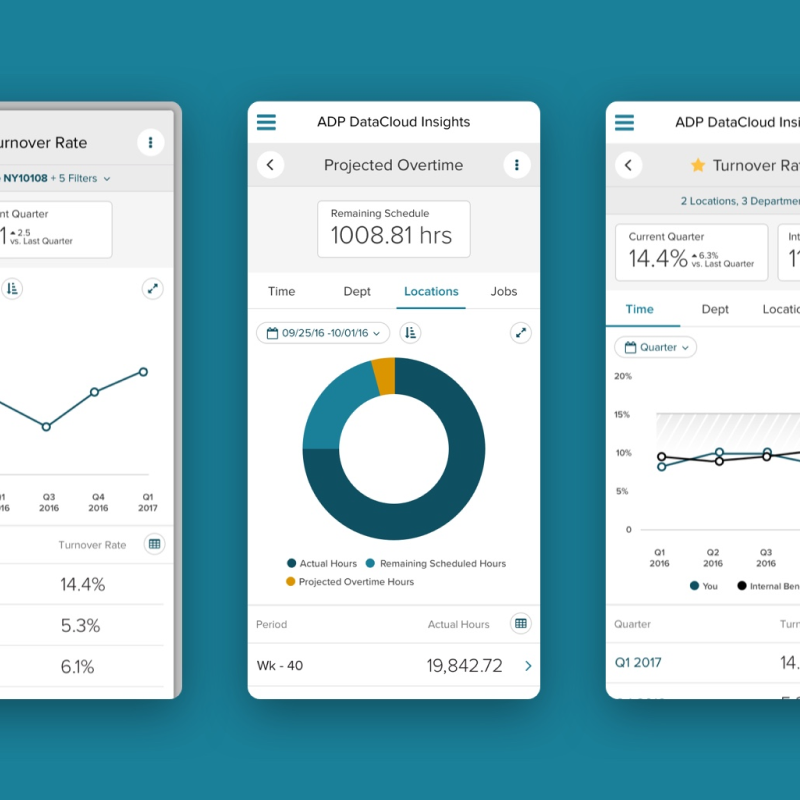
Taking a mobile-first approach, it was clear that our design would have to be efficient in how it displayed data. Instead of landing on a traditional dashboard that would require scrolling and zooming, we worked with data scientists to bubble up key insights based on that company’s unique data. We created a flexible design system to show how each data point would be displayed on screen, and we applied business rules so that each chart type would be used consistently.
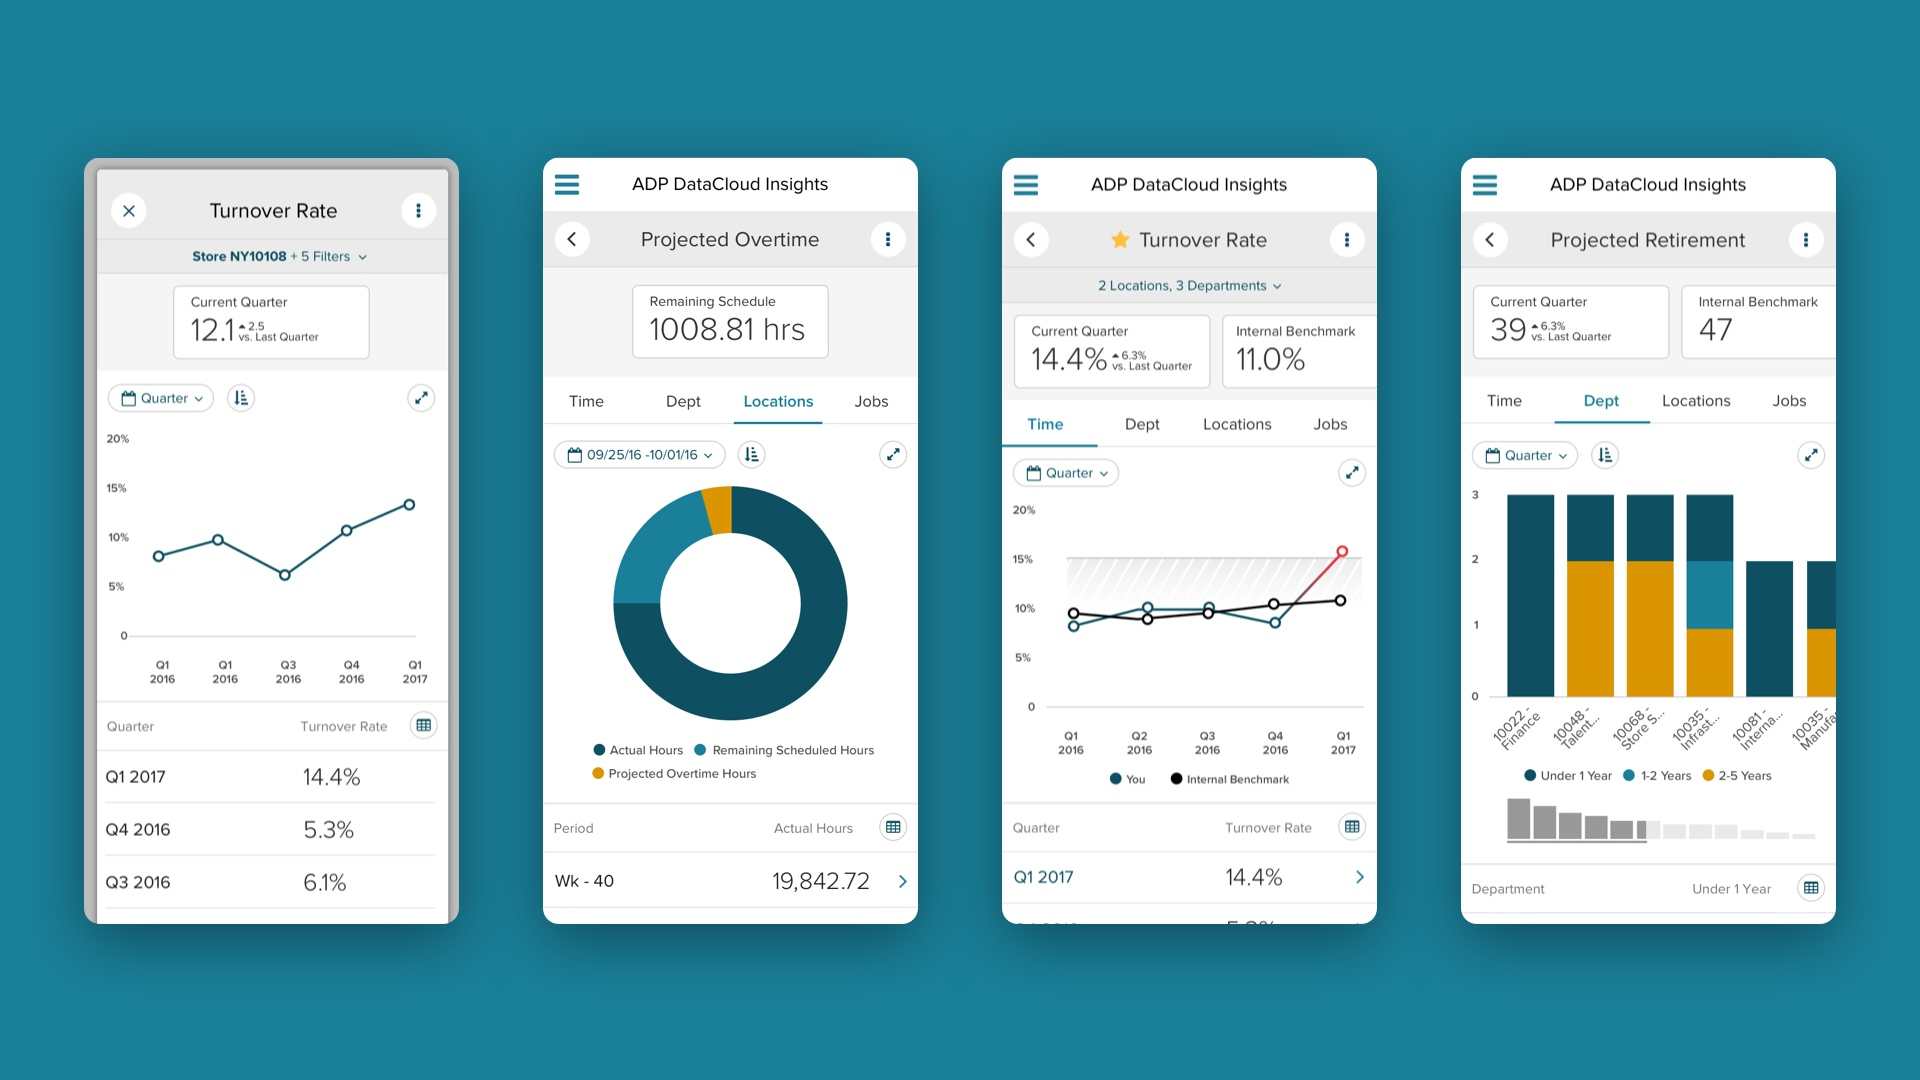
Technical discovery to identify product needs
Neither iOS nor Android had built-in data visualization tools that were robust enough to fulfill the needs of ADP’s customers. Through our technical discovery, we recommended going with an open chart platform that would play nice with native and web-based technologies, and provide a comprehensive library of graphs that we could leverage. This provided a foundation that we could further customize for brand consistency, improved user experience, and the optimization of touch interactions.
MVP design through agile collaboration
This insights tool would live in existing native apps, so our sprint teams worked closely with ADP’s other product teams for the MVP. This partnership included adhering to their sprint and release schedule, integrating our data visualization library into their app design system, and performing thorough visual regression testing to ensure the core apps continued to work smoothly.
Rapid product design and development for users
In a matter of months, ADP was able to put their mobile DataCloud Insights in the hands of users. Data that could have only been accessed through advanced queries in their reporting software was now available to a range of business leaders through the newly designed mobile HR app.