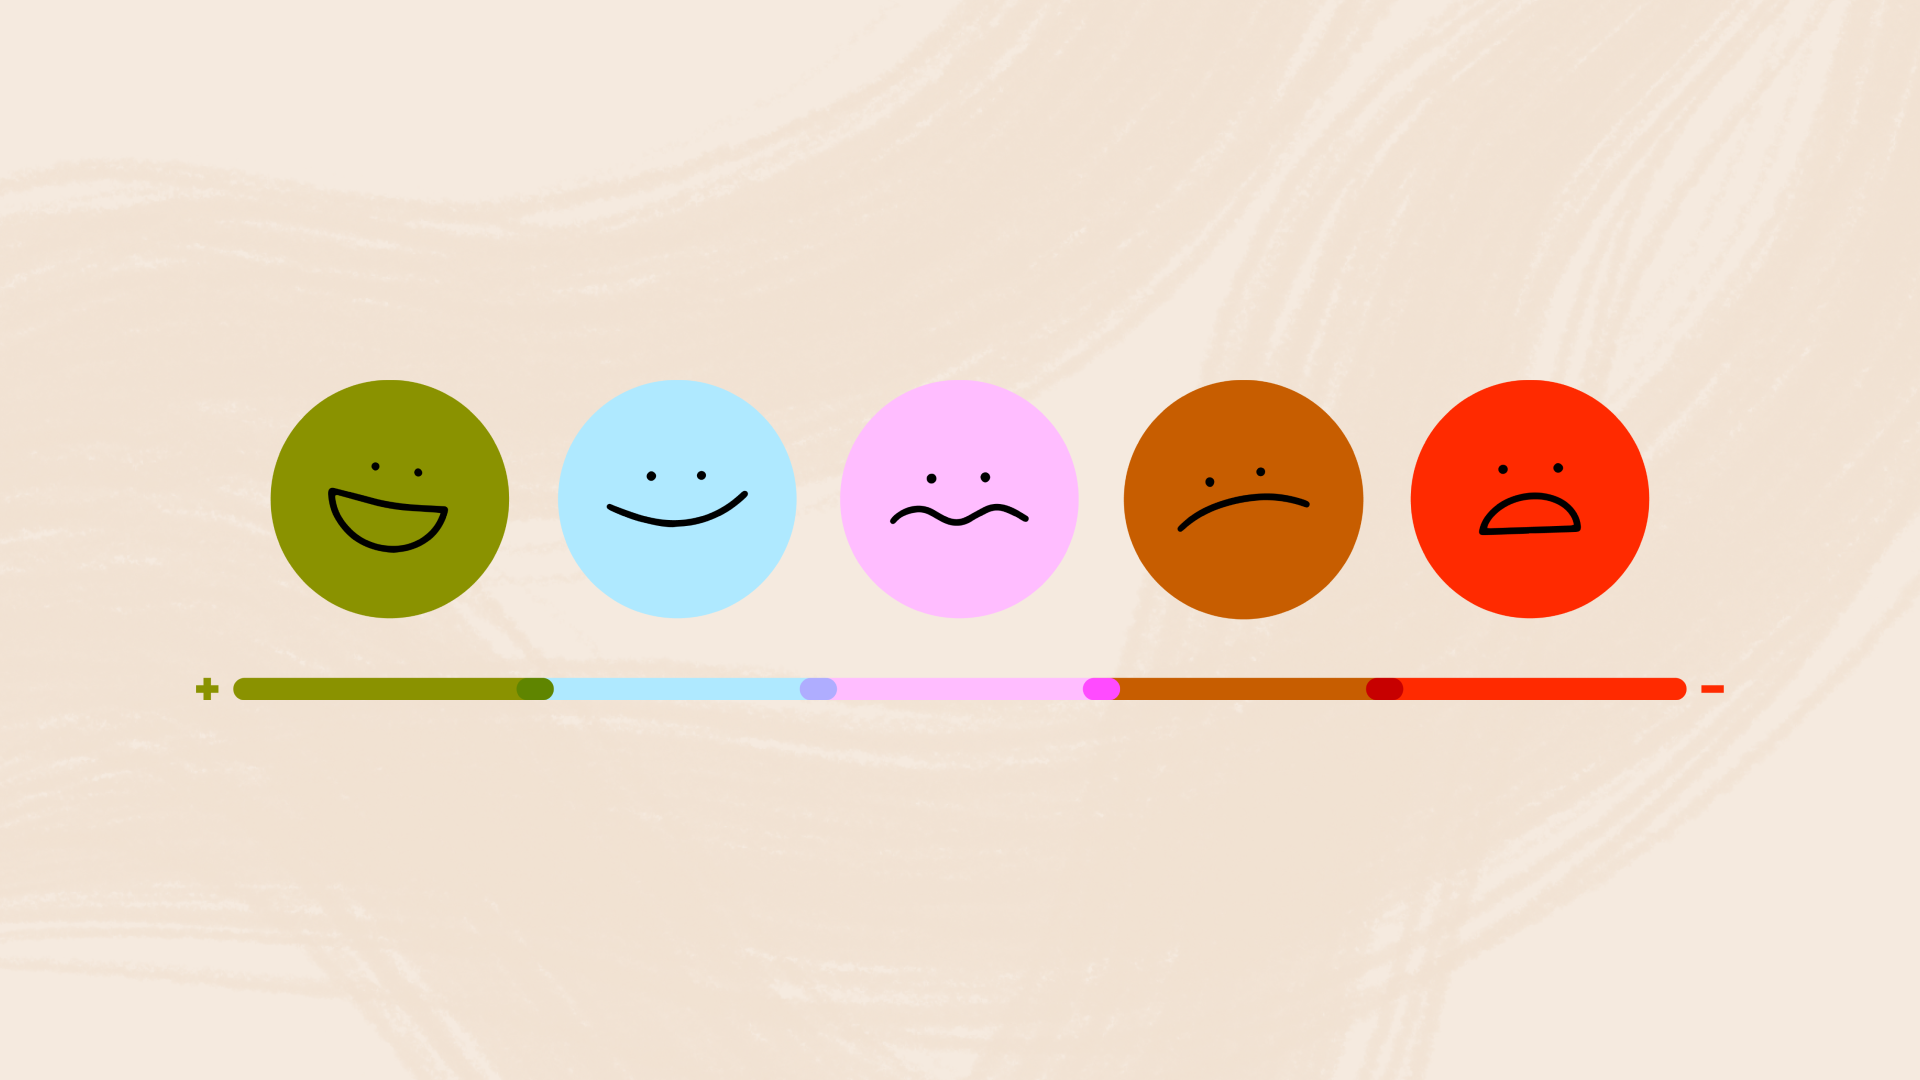
How to SUS out usability scores

So you’re trying to understand how a product is performing? Maybe you’re looking to make improvements or gain a better understanding of customers’ feelings about the usability of a product. The first step in any product redesign effort should be research. Here at Think Company, our research team utilizes an array of tactics and quantitative measurement tools to understand how a product is performing and garner feedback from users in order to make more informed design decisions moving forward. Let’s take a deep dive into one of our favorites, SUS scores.
What is SUS?
The System Usability Scale, or SUS, measures the perceived usability of a system. This is a subjective measure, so SUS scores will vary from one individual to the next (just as I might find an app to be more user-friendly than someone else). Despite the subjective nature, the SUS can serve as a highly reliable, trustworthy tool to determine how “usable” your system is. This is great for benchmarking an app, site, system, or even physical product (though it is most commonly applied to digital experiences). For example, you can use the SUS in A/B testing to learn which version of a product is seen as more usable. Or you can use it to keep a general pulse of a product to inform action: stay the course if scores are climbing or remain high, intervene if they plummet. You can even use it to see how your system stacks up against competitors or industry leaders.
Now that you understand what SUS is, let’s dive in.
Anatomy of the System Usability Scale
The SUS consists of 10 questions, all of which are answered according to a 5-point Likert scale ranging from ‘Strongly Disagree’ to ‘Strongly Agree’. The questions are as follows:
- I think that I would like to use this system frequently.
- I found the system unnecessarily complex.
- I thought the system was easy to use.
- I think that I would need the support of a technical person to be able to use this system.
- I found the various functions in this system were well integrated.
- I thought there was too much inconsistency in this system.
- I would imagine that most people would learn to use this system very quickly.
- I found the system very cumbersome to use.
- I felt very confident using the system.
- I needed to learn a lot of things before I could get going with this system.
You might notice that many questions ask similar things in slightly different ways. This redundancy is done to make the scale more reliable (which, in the scientific sense, means that if you measure the same thing repeatedly you’ll get consistent results).
You might also notice the odd questions are positively phrased, and even questions are negatively phrased (that is, answering ‘Strongly Agree’ indicates good usability for Q1 and poor usability for Q2). This is called reverse coding. This makes scoring a touch more complex, but prevents people from answering on autopilot (i.e. “the system’s fine, I’ll just answer ‘Agree’ across the board”). Like the built-in redundancy, this is a feature incorporated to increase the trustworthiness of the scale. If you want to show off, you can say these features contribute to the strong psychometric properties of the SUS—a fancy way of saying it measures what it claims to measure (that is, perceived usability), and measures it well.
When should you use the SUS? When shouldn’t you?
Any time you want to measure the usability of a single system, the SUS should probably be your first choice. As alluded to above, it has 3 primary uses. These include:
Tracking usability over time
Few systems remain unchanged; they tend to evolve—hopefully for the better—over time. The SUS is an excellent way to ensure that changes are improving usability, or at least not hindering it. Regularly measuring the SUS can allow you to keep apprised of the current usability, and compare this to historical trends. This allows you to make better-informed decisions regarding when to intervene or stay the course.
Comparing versions of a system (A/B testing)
When making changes to a system, it is common to have 2 or more competing alternatives to test. Or you might just want to compare the new version to the previous one, for instance before and after making changes. Regardless, the SUS is extremely amenable to this type of A/B testing.
Comparing your SUS scores to others’ scores
The SUS is a standardized, validated scale. This means it has undergone the rigorous peer review process to be published in academic journals, has been thoroughly tested by skeptical researchers (over the span of 25 years!), and has passed with flying colors. What this means for you is that you can directly compare one SUS score to any other SUS score. You can compare your system’s performance to that of a competitor, or an industry leader you’re aspiring to. While many of these SUS scores can be freely found, some larger collections of SUS scores will require payment. After all, those are valuable data.
Limitations of the System Usability Scale
The SUS quantifies the perceived usability of a single system. It is not, however, diagnostic. That is, it cannot tell you why your system performed at its measured level, or how to improve the score. It won’t tell you if your call to action is unclear, if your content organization is hindering adoption, or if people love that new feature you implemented. This is for you to determine. It is for this reason that A/B testing is generally a good idea, as you can see the positive or negative impact of a change on the SUS score. For instance, if you add a feature and your SUS score jumps, you can be confident the new feature caused the jump.
While the SUS is an incredibly robust test, and can be applied to just about any system (physical or digital), it is only intended to be applied to a single system at a time. For instance, the SUS would be well-suited to measure the usability of your Salesforce instance, but would not be well-suited to measure the entire suite of tools an employee might use to perform their job duties. While the term ‘system’ is intentionally broad, try and use your best judgment here. If using the SUS for a group of tools (which could reasonably be categorized as a single system, such as 2 applications that must be used in conjunction with one another), clearly define the system prior to measurement and explicitly communicate this to your respondents.
SUS score interpretation
Okay, so you now understand what a SUS score is, when to use it and when not to use it, and its limitations, but how do you interpret your findings? What does the data tell you? Let’s dive in!
Percentile ranking
SUS scores range from 0 to 100. It is important to note, however, that these scores are not percentages. So a score of 60 is not necessarily 10% better than a score of 50. Instead, it is more valuable to consider scores in terms of percentile rank, or how a score stacks up against other measured systems. The below chart shows the percentile rank associated with each SUS score, as well as a rough approximation of the letter grade that score corresponds to. You’ll notice that few systems score below 40 or above 80, and that a score of 68 represents the 50th percentile.
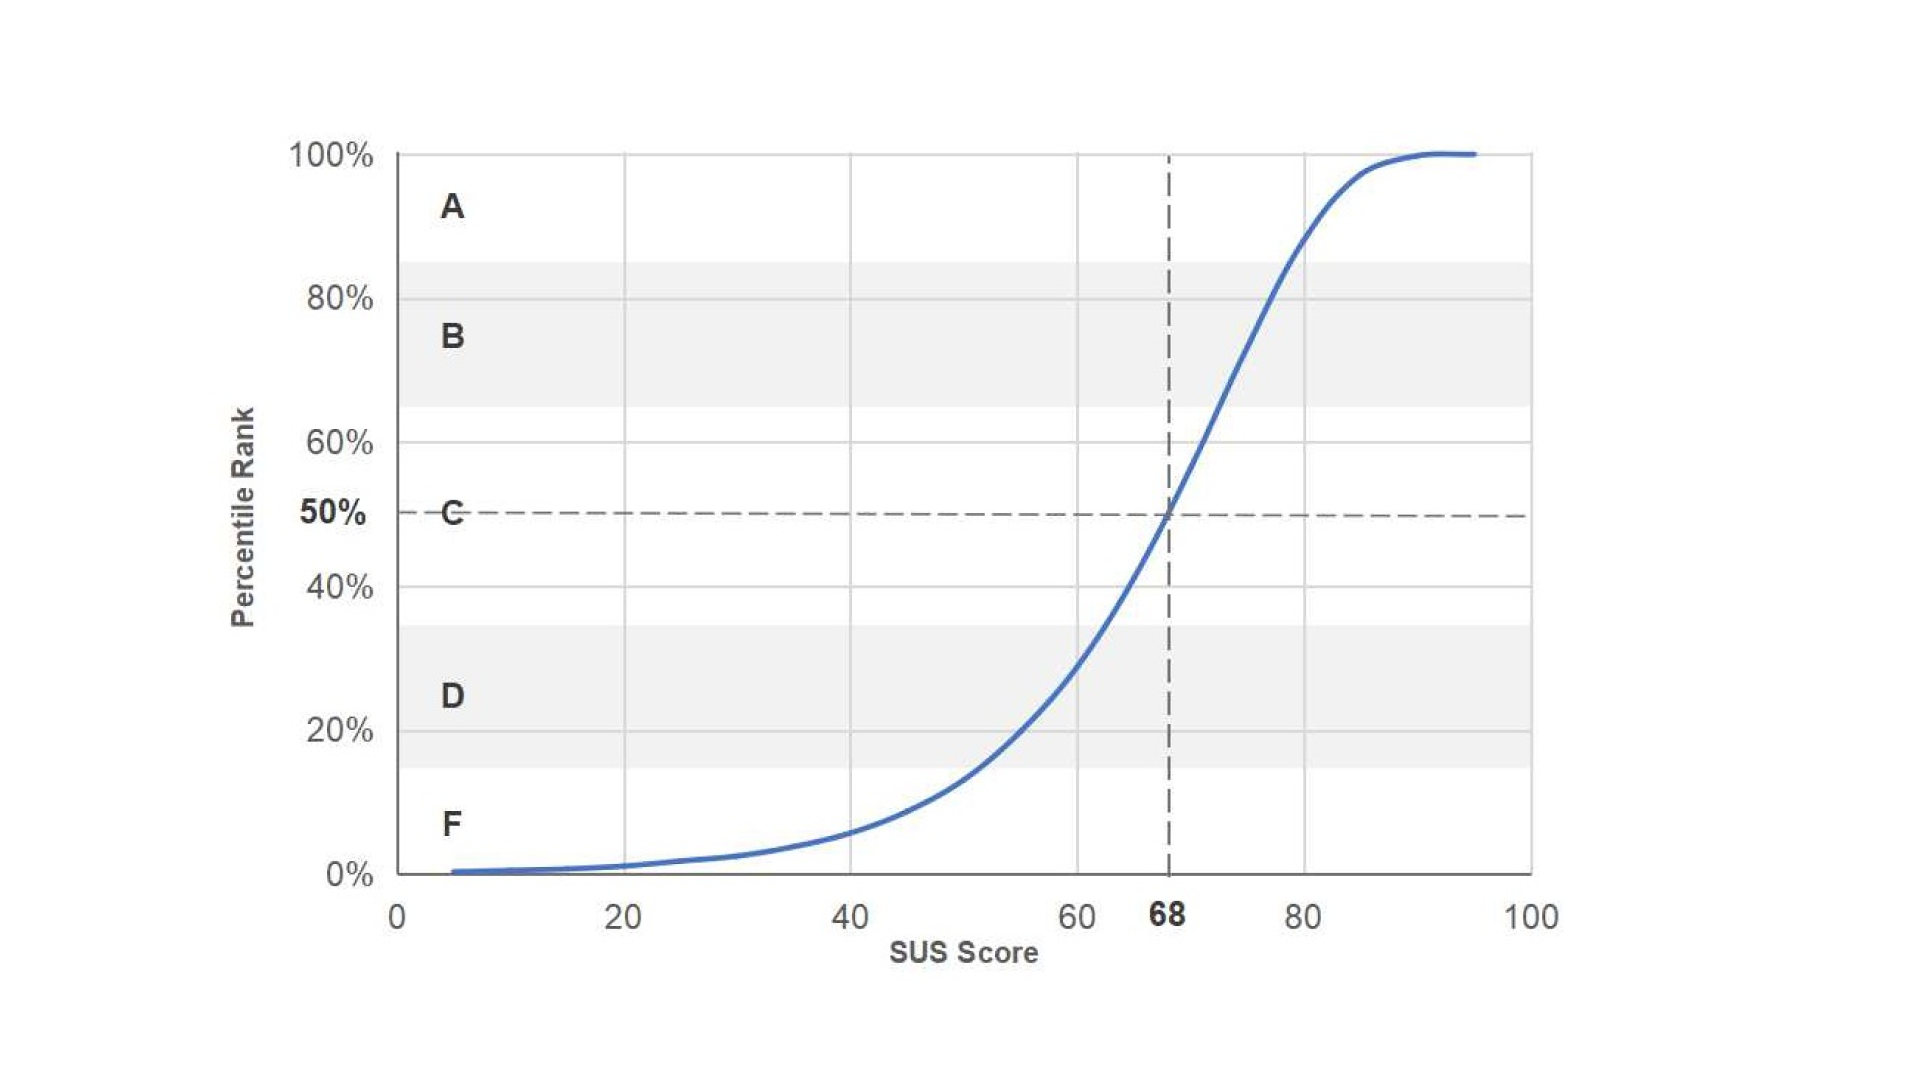
Image source: MeasuringU
A key aspect of this percentile rank chart is that it is not linear; it follows an ‘S’ curve. In practice, this means that increasing your SUS score from 5 to 20 or from 90 to 95 will barely increase your percentile rank. This is because so few scores fall in these ranges that you won’t pass many systems along the way. Conversely, a huge percentage of scores fall between 60 and 80. It is in this range that you get the greatest returns. For instance, increasing your SUS score from 60 to 80 will jump your percentile rank from around the 30th percentile to almost the 90th percentile! That means that for every point increase in your SUS score, your percentile rank will climb almost 3 points!
Understanding the inherent complexity of a SUS score
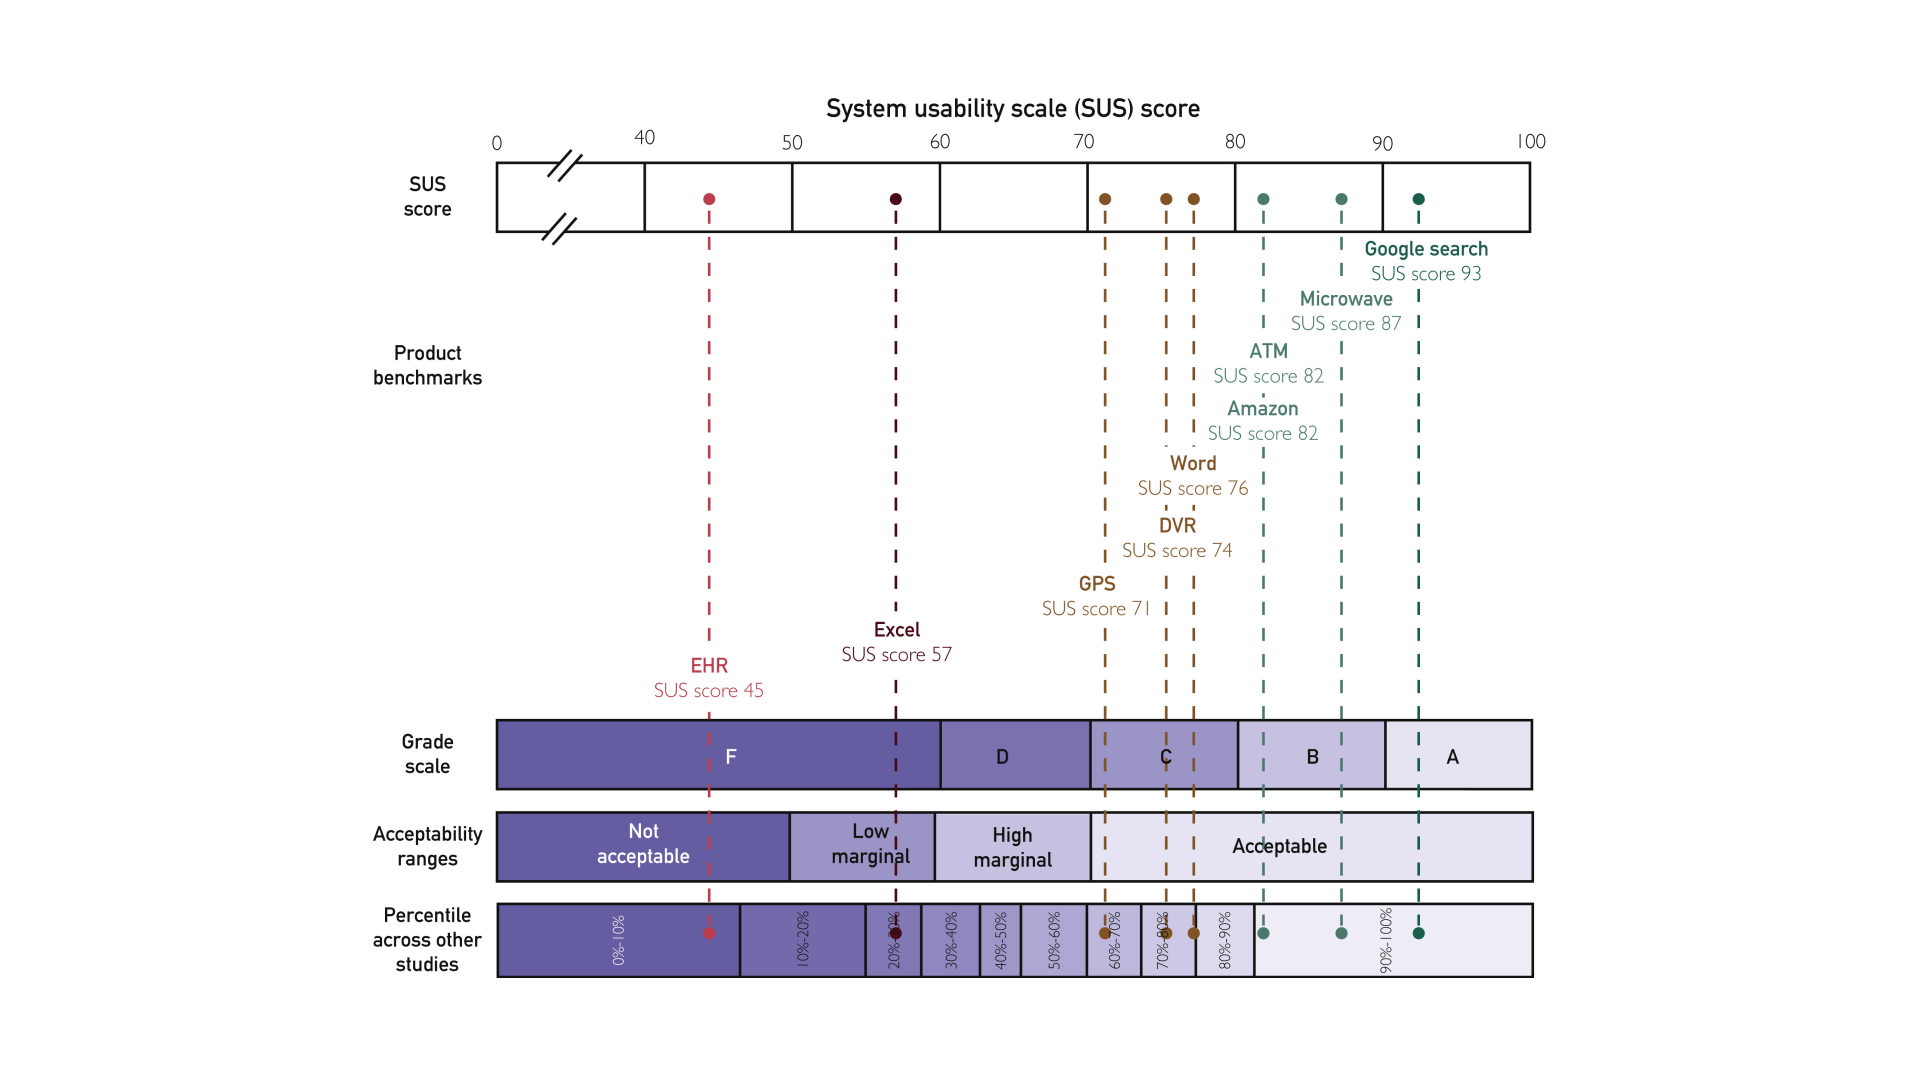
Image source: Mayo Clinic Proceedings
Above you’ll find the SUS scores of some common products. You’ll notice that Google is leading the pack, while tools like Excel or Electronic Health Records (EHRs) don’t score as highly. When analyzing your own SUS scores, remember that the inherent complexity of your system will play a role in its score. Excel offers a ton of features, and requires some complexity to support such functionality. Its low score, therefore, does not necessarily mean it’s a bad product! Google, conversely, is inherently simple; type a phrase, hit enter, skim a few results, done. It’s no surprise its SUS score is so high (not to detract from Google’s usability achievements). All of this is to say that your product’s usability is more than its SUS score, so make sure to consider the inherent complexity when interpreting your score. In this sense, your own previous scores are often the best benchmarks to measure success.
Interpreting SUS scores
If you’re finding this S-curve a bit difficult to interpret, there are plenty of alternative ways to approximate performance on the SUS. The below chart is one such method. It provides a rough estimate of how a SUS score translates to a Net Promoter Score (NPS), a letter grade, and two versions of verbal descriptors.
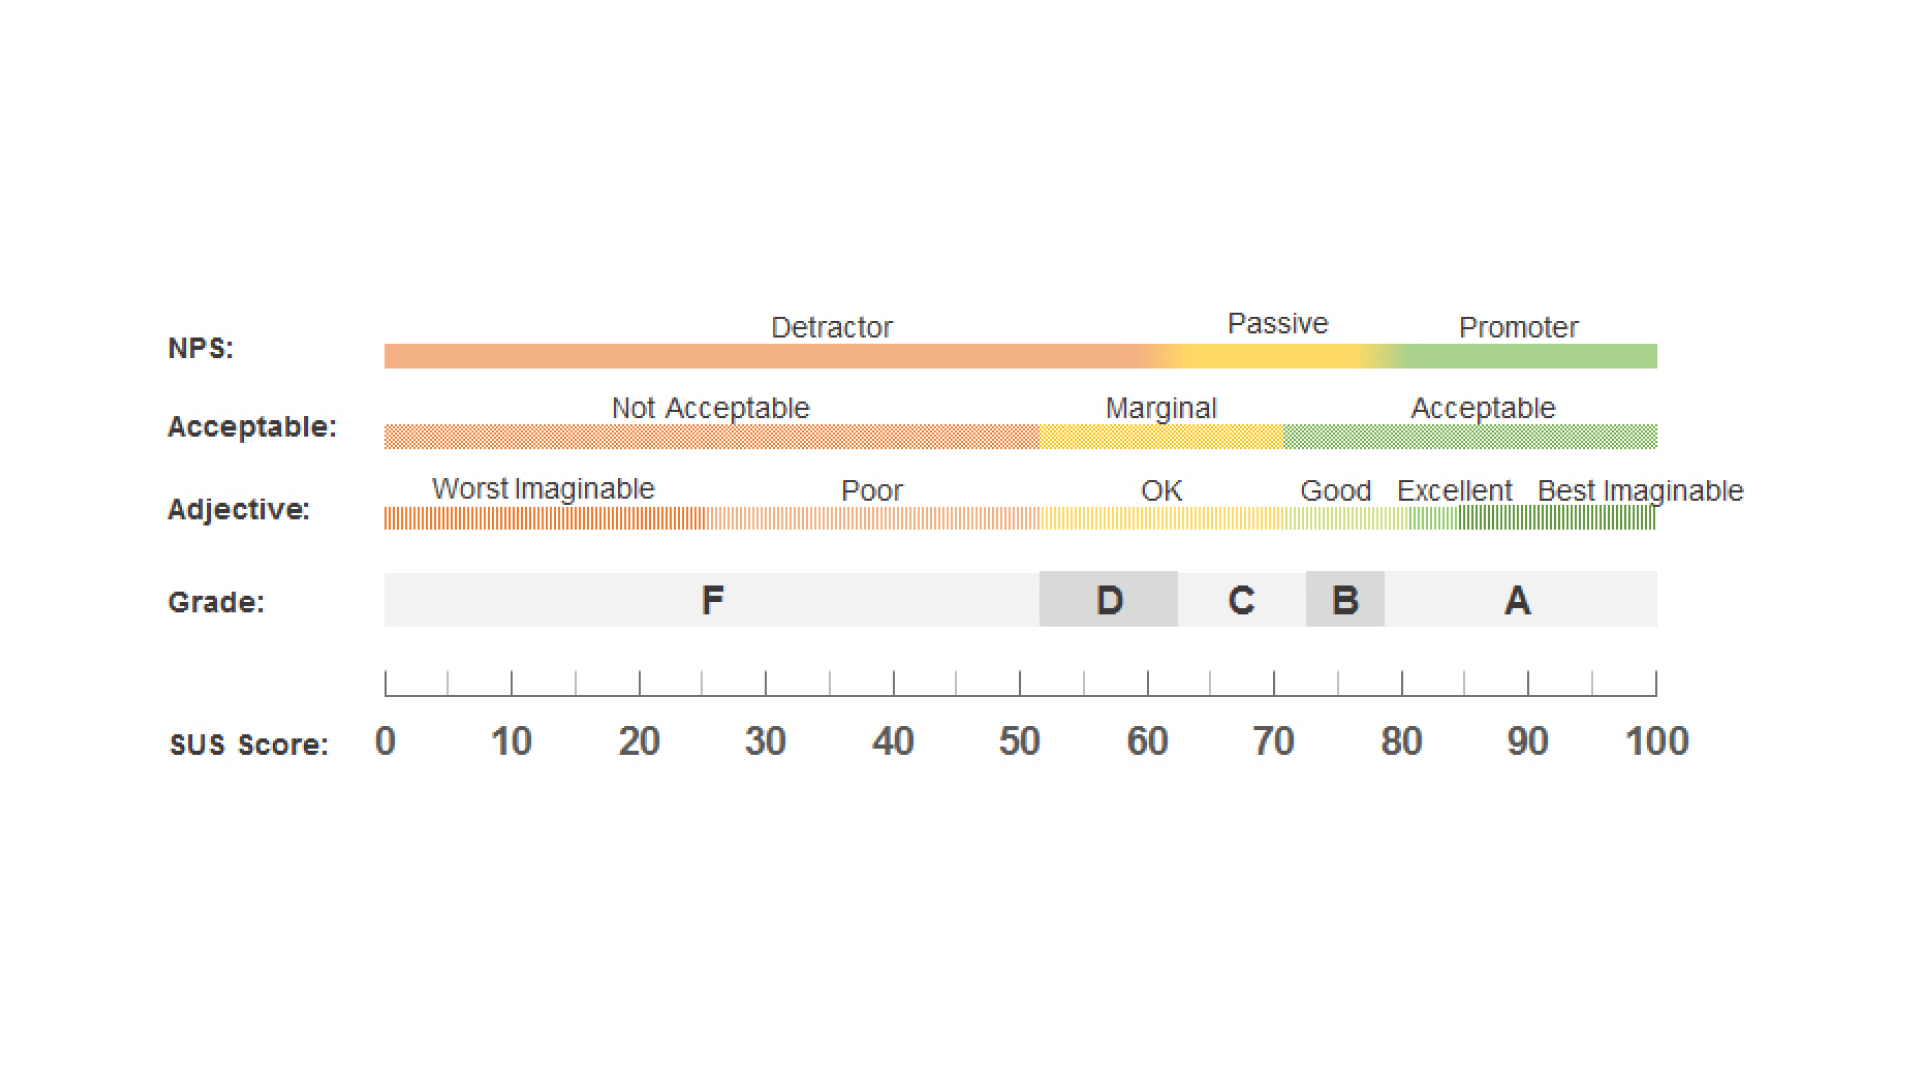
Image source: MeasuringU
Calculating a SUS score
So, how do you actually calculate this SUS score? Begin by downloading the numerical data from whatever survey tool you used (so that ‘Strongly Disagree’ corresponds to 1, and ‘Strongly Agree’ corresponds to 5). Subtract 1 from every odd question. For even questions, subtract the value from 5.
These adjustments accomplish 2 things. First, it adjusts the scale range from 1 through 5 to instead span 0 through 4. Second, it flips the negatively coded questions (the even ones) so that a score of 4 always indicates the highest usability score.
Lastly, add up all the adjusted scores and multiply by 2.5. This adjusts the scale to be out of 100 points. If that all sounds a bit complicated, don’t worry. There are plenty of tools out there to calculate SUS scores for you, like this SUS calculator from UIUX Trend.
Unlock valuable usability insights with SUS
Whenever you’re looking for a way to quantify the usability of a system, look no further than the SUS. This trustworthy tool offers valuable insights and helps you back product design decisions with data—so you can keep a pulse on products, measure the efficacy of changes, or compare yourself to industry leaders.