Data visualization, and identifying the true challenge within the question

It started when a developer on a client’s team approached me with a question: “Hey, you know D3.js right? Could you help us visualize some data?”
“Of course,” I said. That’s one of the reasons they brought us in, after all! “What are you trying to achieve?” Asking one seemingly simple question was the difference between delivering the requested solution and implementing a solution that went beyond the request to expose even more useful information.
We were in the middle of reskinning a legacy application built in a tech stack from a bygone era. Most of the codebase was decades old; a gnarly, tangled rubber-band ball of dependencies—the epitome of what developers refer to as “spaghetti code,” full of bad practices.
One notable challenge affected us daily: there was no file naming convention, and often there were duplicate files in different folders, so no one knew where the definitive version of any particular asset resided without a lot of hunting and guessing. Every time a change was required, work started with spelunking into the code base—or even worse, searching the database. It was the proverbial haystack, and we were always looking for a hay-colored needle.
For this and other reasons, the client developer recognized what we were up against. Any development task inevitably led to the questions, “What is the risk of this change? What else will be affected?”
The team set out to make a spreadsheet of all the dependencies. File A depends on File B, File B depends on File D, etc. But once we had compiled all of that data, it still wasn’t useful to humans. That’s when I was asked, “You know D3.js, right?”
D3.js is a JavaScript-based data visualization library that we leverage on a fairly regular basis. The hope was that I could visualize all these dependencies—about 3,519 of them—to paint a picture of what we already knew for the rest of the organization: things were a mess.
The pivotal moment came from a seemingly simple question. Before just following orders, I asked, “What are you trying to achieve?” We spoke about what the data was, what sort of questions we’d want to answer, and I had an epiphany: D3 is a great tool for custom visualizations (and as in this case, is often requested/prescribed by the client at the outset), but like all tools, you need to know when to use it.
Some time ago, I was introduced to a tool called Neo4j, a Graph Database engine. I had barely tinkered with it, but I understood the general concept. Graph databases are primarily concerned with storing two things: nodes (“things”) and relationships. Any point of data is a node, and how it relates to other nodes is, well, the relationship. Graph databases are perfect for asking questions about how things are related, and how relationships are shared.
So a graph database seemed like the direction to go: instead of a simple visualization generated after several hours of development, we had useful, pretty graphs we could query within minutes.
We could ask all kinds of questions: “What files have the most relationships? What files have no relationships? What files include ExampleFile.cfm?” Suddenly, we had a map. Because of the nature of Neo4j, we could easily add additional data as we wanted to ask more questions: “What files use this global variable? What files make direct database calls?” And as a bonus, all the visualizations are done with… you guessed it… D3, right out of the box.
Say we want to make a change that involves a particular file, but we need to know the impact it will have on the current codebase?
We can ask Neo4j “Hey, what files rely on ‘exampleFile.cfm’?” :
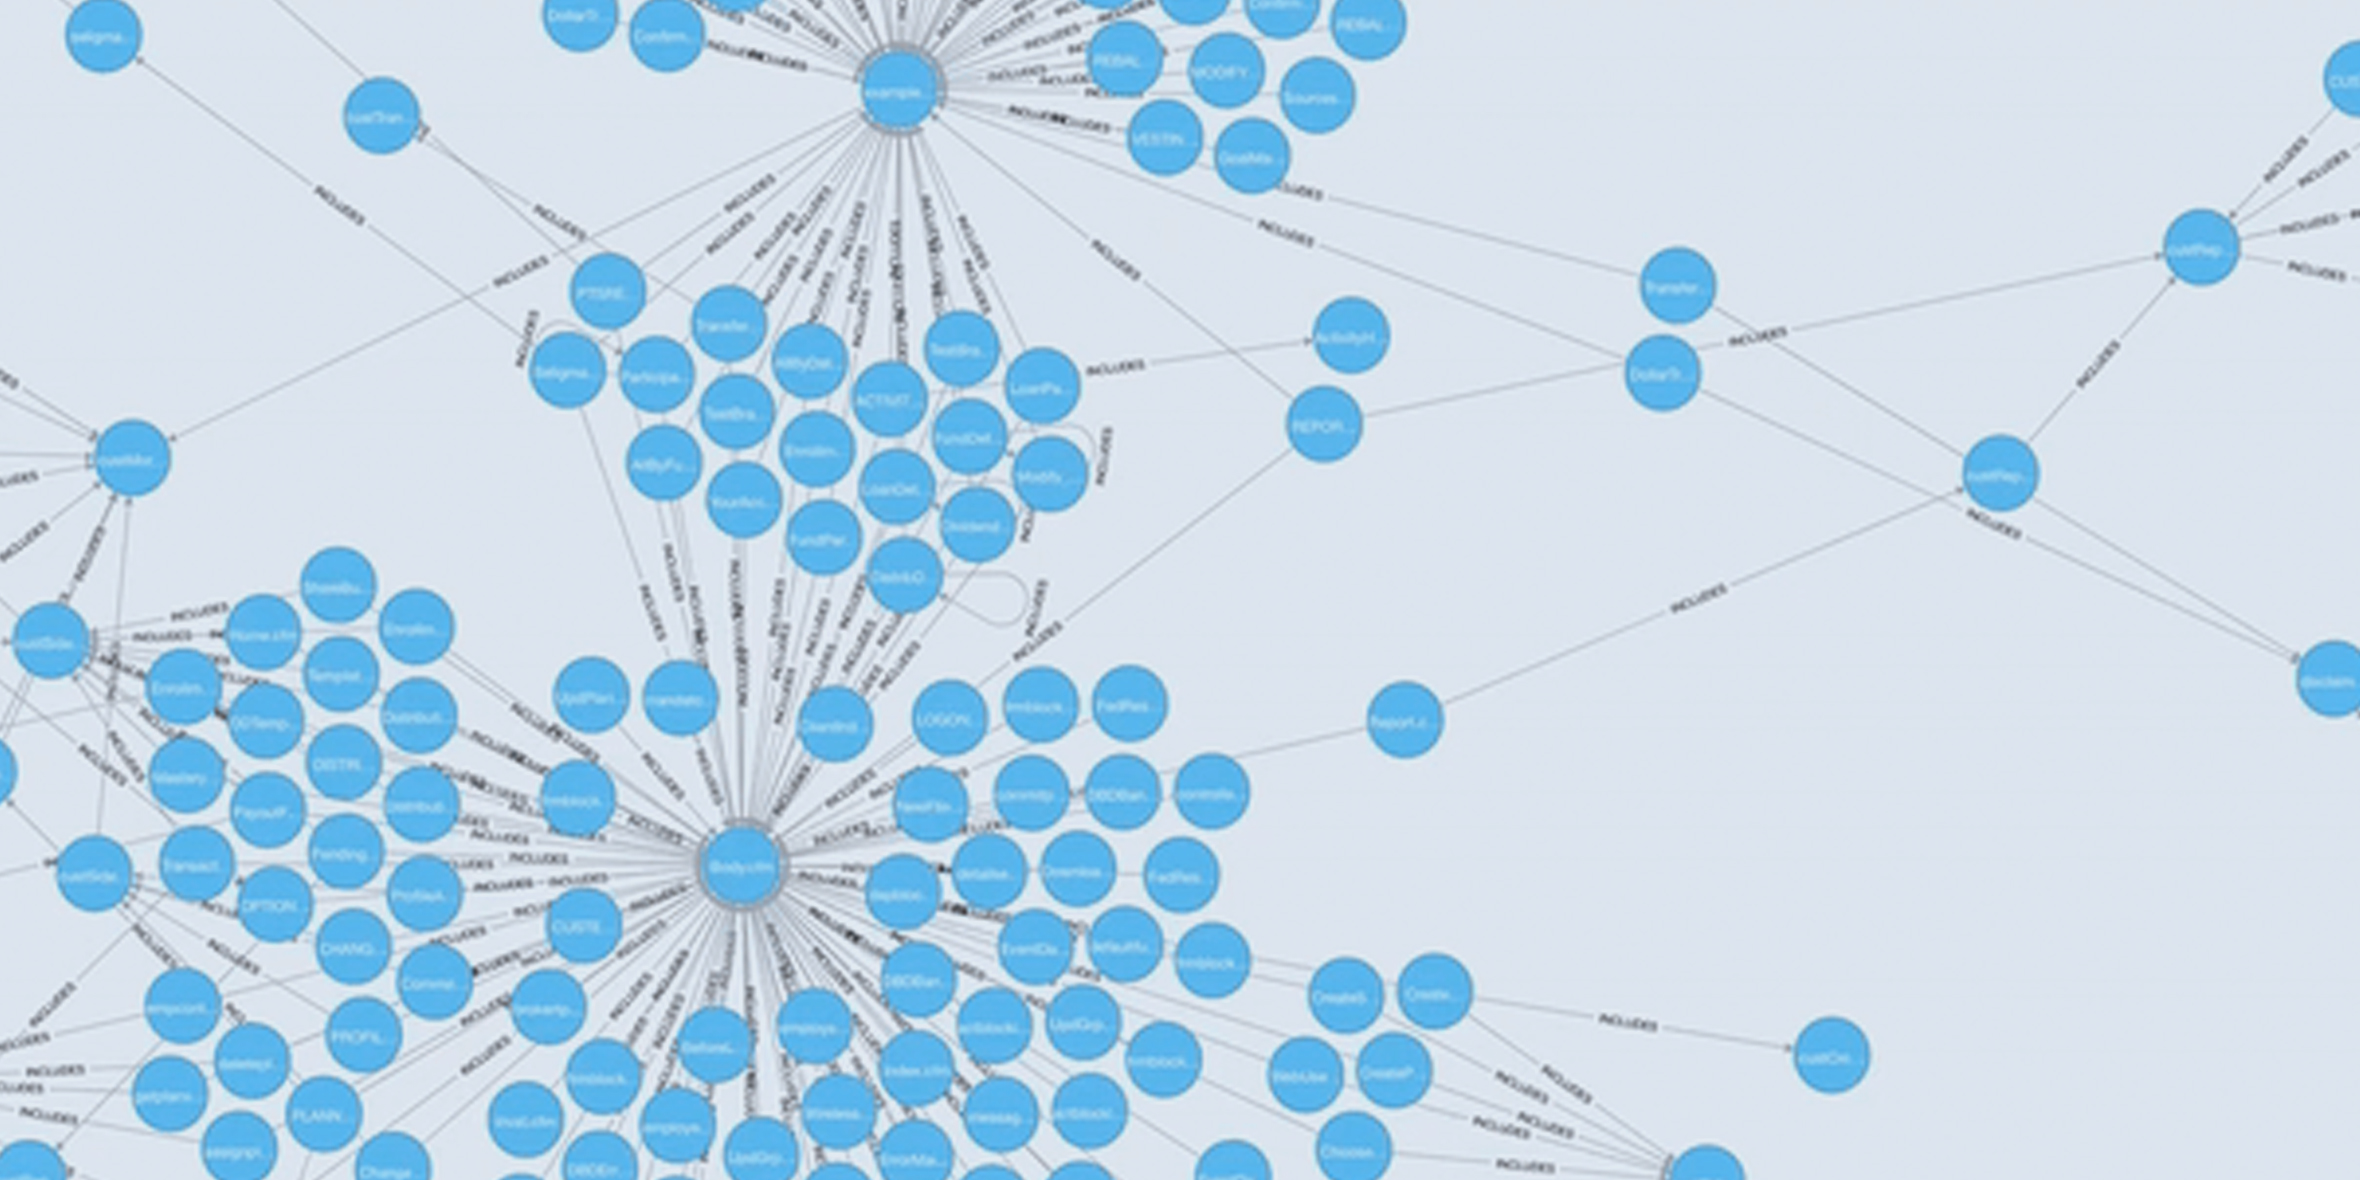
Or “Show us all the relationships in our application”:
Instead of a static visualization, we have our data in a queryable format!
The most important thing I learned is to always get to the root of what the client is trying to do. “What are you trying to achieve?” is a powerful question, and can be the difference between a satisfactory outcome and a robust solution for the client. When exposed to the dev team at large, they were immediately inspired to ask more questions of the graph database. Instead of a good-enough tool, we leveraged a tool that got us even closer to making our case and solving the issue.
The whole journey was a good reminder: expand your horizons outside your discipline, and always look for the right problem to solve—not necessarily the literal question you’re presented with. This approach leads to solutions that exceed expectations.